Your survey is done, you download the responses, and the whole file is text: “Strongly agree”, “Female”, “$500 to $1,000”. The column names are entire questions, and checkbox answers are crammed into a single cell. SPSS cannot run anything on data like this. This guide takes you through 6 steps to move Google Forms data into SPSS, from downloading and cleaning to coding and declaring variables, plus the traps that quietly corrupt your results.
1Why you cannot run SPSS on the raw Google Forms file
| Problem in the download | What happens in SPSS |
|---|---|
| Answers are text (“Agree”) | String variables: no means, alpha or EFA |
| Column names are whole questions | SPSS shortens them or renames to V1, V2… |
| Checkboxes share one cell (“Facebook, TikTok”) | You cannot count each option |
| Test, duplicate or off-target responses | Skewed results and an inflated sample |
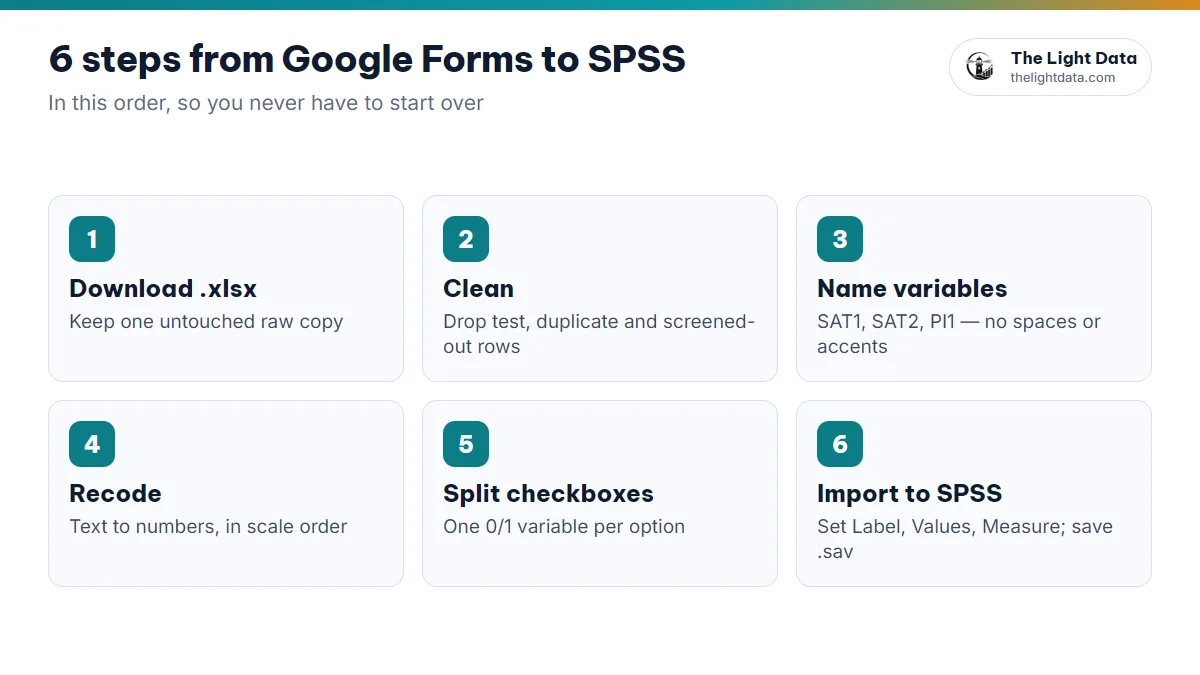
2Step 1: Download the responses from Google Forms
- Google Form→Responses→Link to Sheets
- Google Sheets→File→Download→Microsoft Excel (.xlsx)
Save one raw copy you never edit and do all your work on a duplicate. If you need to check something or your supervisor asks for the source data, it is there.
3Step 2: Clean the data and remove invalid responses
According to Pallant (2020), cleaning is a required step before any analysis. Go through:
- Test responses: the ones you submitted to try the form.
- Duplicates: the same person submitting more than once.
- Failed screening or attention-check questions.
- Straight-lining: the same answer to every Likert item, including reversed ones.
- Too many blanks in the main scales.
Note how many responses came in, how many you removed and why, and how many remain. Committees often ask about this in the methods and results chapters.
4Step 3: Name your variables for SPSS
Replace the long column titles with short names that follow SPSS’s rules: start with a letter, no spaces, no special characters, no duplicates. Use construct code + number: SAT1, SAT2, PI1…
| Google Forms column | SPSS variable |
|---|---|
| What is your gender? | GENDER |
| I am satisfied with the product quality | SAT1 |
| I will keep buying this product | PI1 |
The full question is not lost: it goes into the Variable Label in step 6.
5Step 4: Recode text answers to numbers
Option 1: Find & Replace in Excel
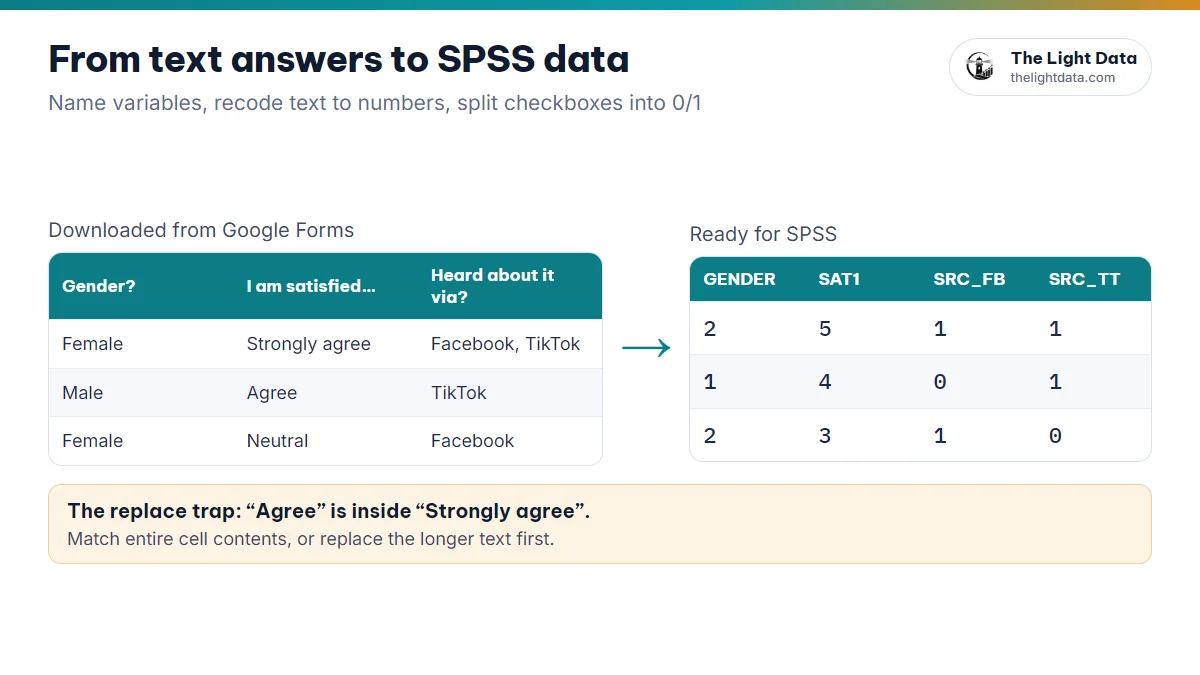
Replace “Strongly agree” → 5, “Agree” → 4 and so on across the Likert columns.
“Agree” sits inside “Strongly agree”, and “Disagree” contains “agree” too. Replace “Agree” first and you get “Strongly 4”. Always turn on “Match entire cell contents”, or replace longer text before shorter text.
Option 2: Recode in SPSS
- Transform→Recode into Different Variables→Old and New Values
- Enter each pair: Old Value (String) “Strongly agree” → New Value 5, and so on.
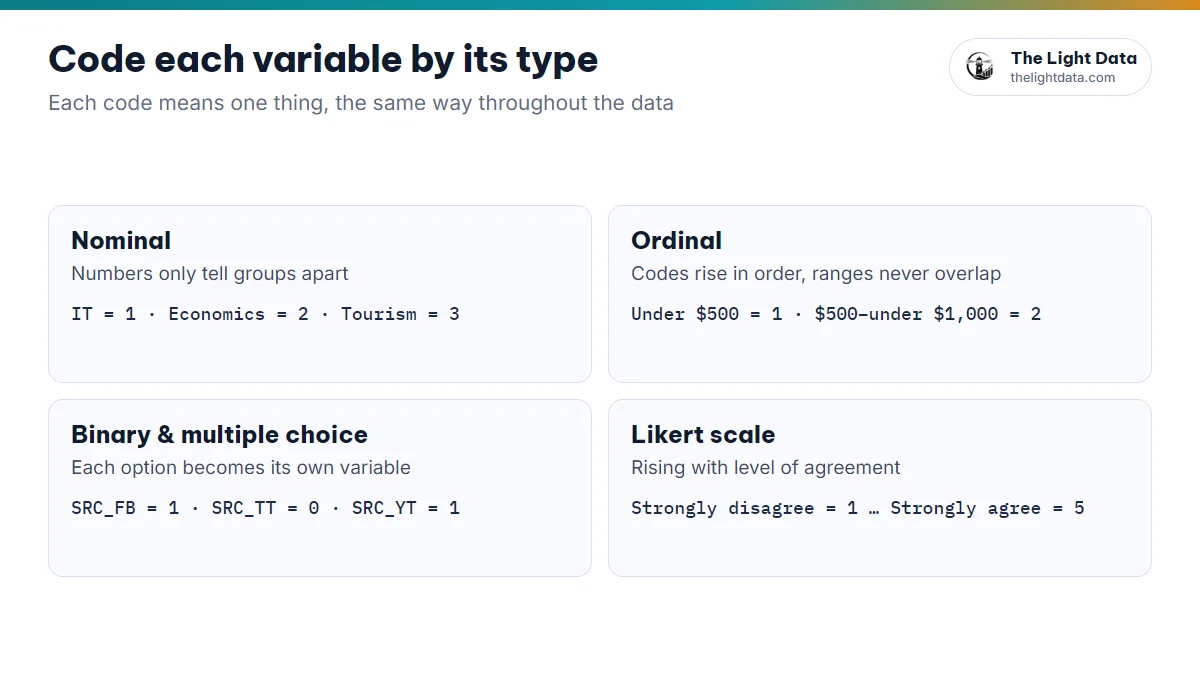
Transform → Automatic Recode assigns codes in alphabetical order, not by level: “Agree” becomes 1, “Disagree” 2, “Neutral” 3… Your scale is scrambled, and alpha and regression are wrong without any error message.
6Step 5: Split multiple-choice (checkbox) answers
Google Forms puts all selected options in one cell, separated by commas. Each option must become its own variable with 1 (selected) or 0 (not selected):
| Original answer | SRC_FB | SRC_TT | SRC_YT |
|---|---|---|---|
| Facebook, YouTube | 1 | 0 | 1 |
| TikTok | 0 | 1 | 0 |
In Excel, a formula such as =IF(ISNUMBER(SEARCH("Facebook",C2)),1,0) works for each column. Watch out for option names that contain commas or that sit inside another option’s name.
To analyze them, use Analyze → Multiple Response → Define Variable Sets for a frequency table across the group.
7Step 6: Import into SPSS and declare your variables
- File→Open→Data→pick the .xlsx · tick “Read variable names”
- In Variable View, fill in Label (the question), Values (1 = Male, 2 = Female…), Missing and Measure (Nominal / Ordinal / Scale).
- Check with Analyze → Descriptive Statistics → Frequencies that no odd values remain (such as a 6 on a 1–5 scale).
- Save as .sav, which works for both SPSS and AMOS.
8How to convert Google Forms to SPSS automatically
With a few dozen questions and a few hundred responses, steps 3–5 can eat an entire afternoon, and one wrong replacement ruins a whole column. The Light Data’s SPSS encoding tool follows one consistent plan:
- Paste the Google Form link: an AI assistant reads the questions and proposes valid SPSS variable names and a coding table.
- Review the coding plan: adjust names and values if needed (free).
- Add the responses sheet link, shared as “Anyone with the link can view”.
- Download the Excel file with a coded data sheet (checkboxes already split into 0/1) and a codebook sheet, ready to open in SPSS.
You still do the cleaning in step 2 yourself, because those are academic decisions only you can make. Credits are charged only when a file exports successfully; reading the form and reviewing the plan are free.
- You have a raw copy, and removed test, duplicate and invalid responses with counts recorded.
- Variable names are short and valid; Likert items are numbers 1–5 in the right direction; reversed items are flagged.
- Checkboxes are split into 0/1; Variable View has Label, Values and Measure.
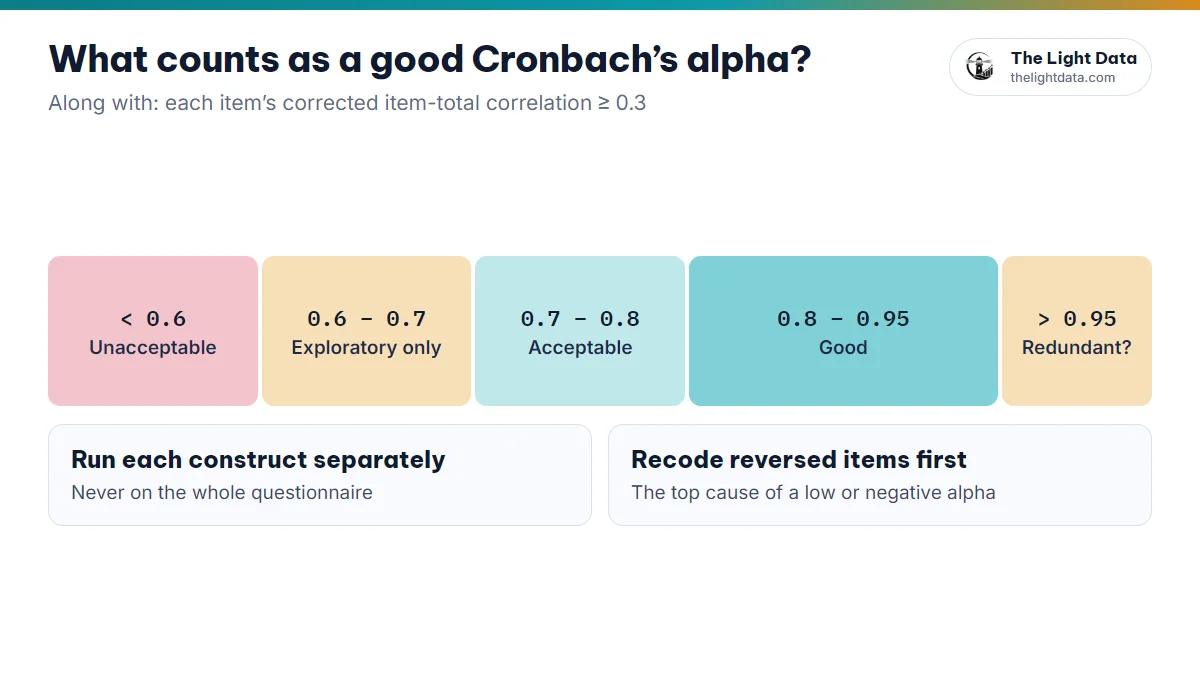
- Frequencies show no odd values, so you are ready for Cronbach’s alpha.