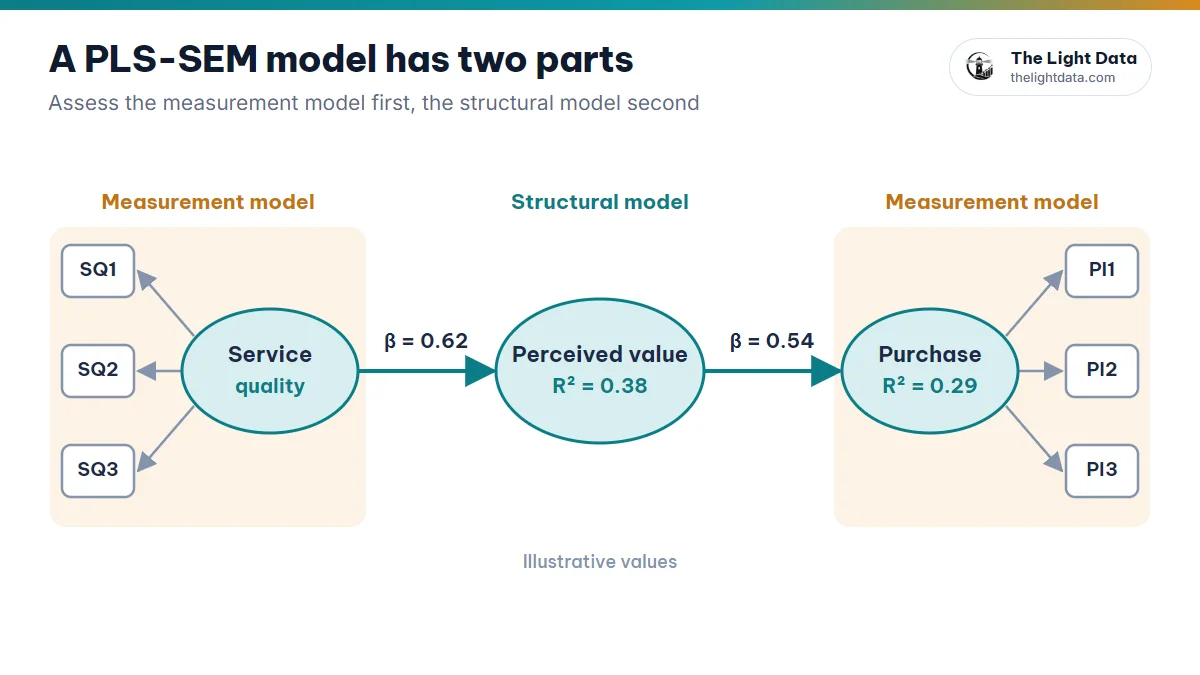
You run the PLS algorithm and every table has a red cell: one construct’s AVE is 0.46, HTMT between two constructs hits 0.92, a few outer loadings sit around 0.6. Which item do you drop to make the scale pass without breaking the model? This guide covers assessing a measurement model in SmartPLS using the 6 criteria from Hair et al. (2022), with examples, thresholds and a process for when a criterion fails.
The standards come mainly from Hair, Hult, Ringle & Sarstedt (2022), A Primer on Partial Least Squares Structural Equation Modeling (PLS-SEM), 3rd edition. This article applies to reflective measurement models.
1Outer loadings: what value is acceptable?
An outer loading shows how strongly each indicator correlates with the construct it measures. The larger the value, the better the indicator reflects the concept.
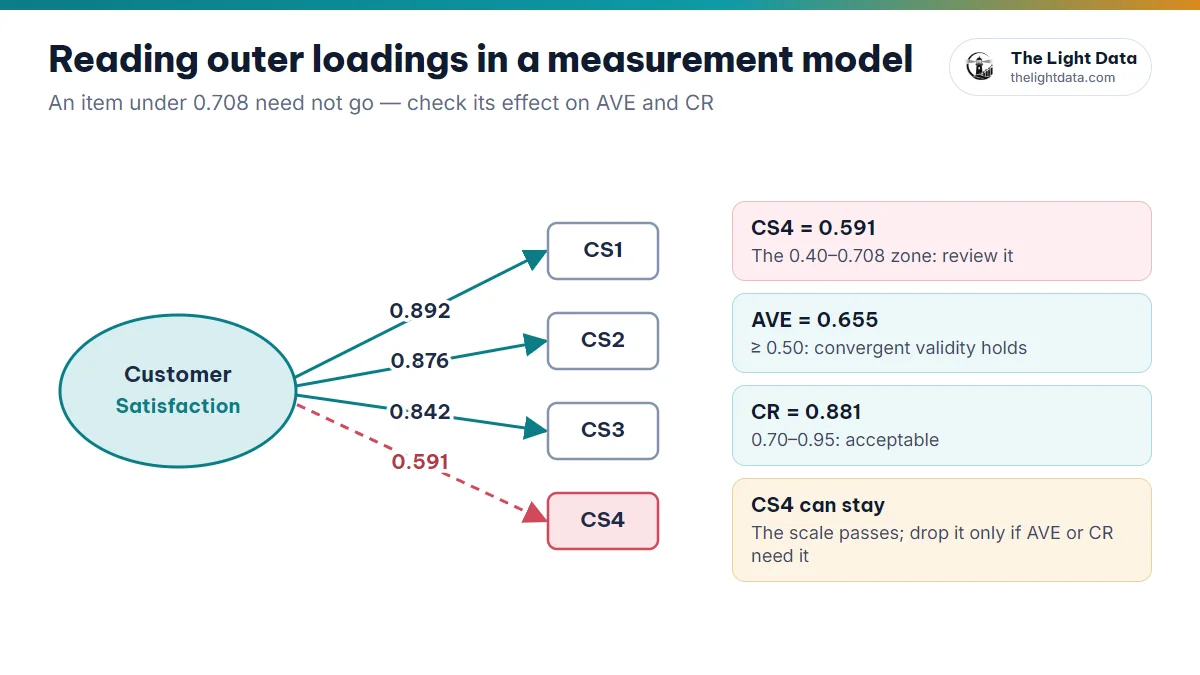
The construct Customer Satisfaction is measured by four indicators:
- CS1: I am satisfied with the product quality.
- CS2: The product meets my expectations.
- CS3: I will keep using the product.
- CS4: I will recommend the product to others.
| Indicator | Outer loading |
|---|---|
| CS1 | 0.892 |
| CS2 | 0.876 |
| CS3 | 0.842 |
| CS4 | 0.591 |
CS1–CS3 reflect the concept very well. CS4 (0.591) is in the review zone: whether to keep it depends on its effect on CR and AVE, and on what it contributes to the concept (see section 7).
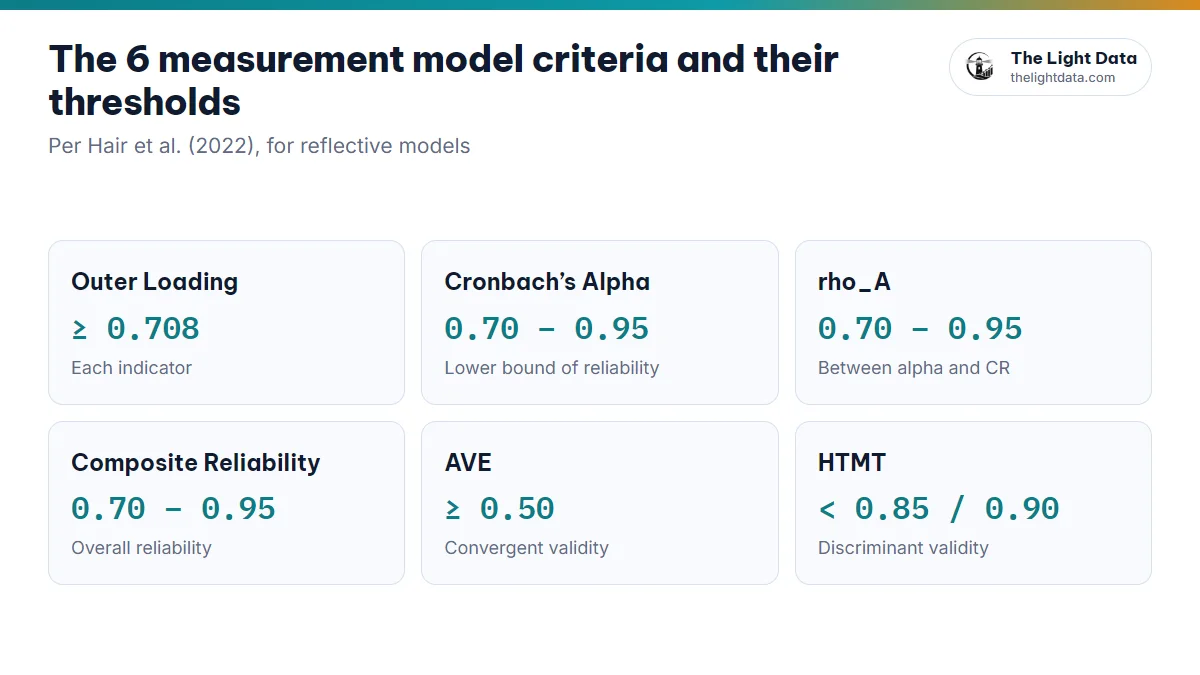
- ≥ 0.708: Acceptable
- 0.40 to 0.708: Review (keep or remove)
- < 0.40: Remove
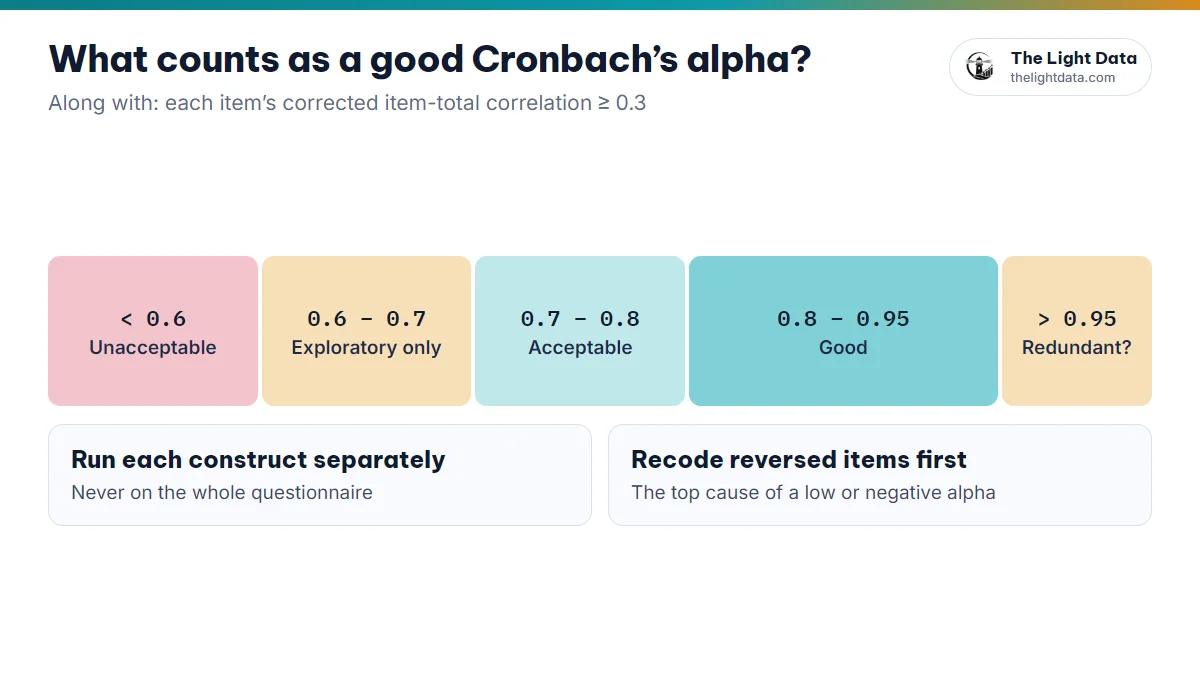
2Cronbach’s alpha: internal consistency
The traditional measure of consistency among the indicators of a concept. In PLS-SEM it is treated as a lower bound of reliability, because it assumes every indicator carries equal weight.
A Brand Trust scale with 5 items: alpha = 0.865, so the items are highly consistent. An alpha of just 0.52 would mean some items need another look.
- 0.70 to 0.95: Acceptable (0.80–0.90 is ideal)
- 0.60 to 0.70: Acceptable in exploratory research
- < 0.60: Unacceptable · > 0.95: Items repeat each other
3rho_A: a more exact reliability measure
From Dijkstra & Henseler (2015) and recommended by Hair et al. (2022), rho_A uses the actual loadings, so it sits between Cronbach’s alpha (the lower bound) and CR (the upper bound), giving a closer picture of true reliability.
A Perceived Value scale: alpha = 0.812, rho_A = 0.847, CR = 0.886.
- 0.70 to 0.95: Acceptable
- < 0.70: Below standard · > 0.95: Possibly redundant
4Composite reliability (CR)
CR accounts for each indicator’s actual contribution, showing how well the indicators together measure one concept.
Service Quality: SQ1 = 0.88, SQ2 = 0.84, SQ3 = 0.86, SQ4 = 0.91 gives CR = 0.93. The indicators work very well together.
- 0.70 to 0.95: Acceptable
- < 0.70: Below standard
- > 0.95: The items are too alike; information is redundant
5AVE: what value shows convergent validity?
From Fornell & Larcker (1981), average variance extracted (AVE) is the share of the indicators’ variance explained by the construct. It tells you whether the indicators really converge on one concept.
Purchase Intention: AVE = 0.684 explains 68.4% of the variance, above 50%, so convergent validity holds. At AVE = 0.39, more than half the variance is measurement error.
- AVE ≥ 0.50: Convergent validity holds
- AVE < 0.50: Not established
6HTMT: what value shows discriminant validity?
From Henseler, Ringle & Sarstedt (2015), and treated by Hair et al. (2022) as the main criterion for discriminant validity, HTMT shows whether two concepts are really different or are measuring the same thing.
| Pair of constructs | HTMT |
|---|---|
| Service Quality ↔ Customer Satisfaction | 0.73 |
HTMT = 0.73 (below 0.85) means clearly distinct. At 0.96, the two constructs may well be measuring the same thing.
- < 0.85: Good (conceptually different constructs)
- < 0.90: Acceptable for conceptually similar constructs
- ≥ 0.90: Signs of a discriminant validity problem
Also look at the bootstrap confidence interval for HTMT: if its upper bound is below the threshold (0.85 or 0.90), discriminant validity is on firmer ground. Fornell–Larcker can be reported alongside but should not be your only evidence.
7When a criterion fails: what to do
- Remove any indicator with an outer loading below 0.40.
- For indicators between 0.40 and 0.708, try removing the single lowest and re-run.
- Keep the removal only if it lifts AVE or CR past the threshold and does not damage what the concept means.
- Repeat one at a time, and keep at least 3 indicators per construct where you can.
HTMT ≥ 0.90
- Reread both constructs’ items: does any straddle the two?
- Check cross-loadings: items loading high on the other construct are candidates for removal
- If theory allows, consider merging the constructs
Alpha or CR above 0.95
- The items nearly repeat each other
- Consider removing duplicated content
- Check for straight-lined responses
Each removal needs a statistical and a content reason, and a record. Never edit data to make a criterion pass. If a scale stays weak, report it honestly under limitations.
8Reporting the measurement model in your thesis
This usually takes 3 tables: (1) outer loadings; (2) reliability and convergent validity; (3) HTMT.
| Construct | Alpha | rho_A | CR | AVE |
|---|---|---|---|---|
| Service Quality | 0.896 | 0.899 | 0.928 | 0.762 |
| Perceived Value | 0.812 | 0.847 | 0.886 | 0.722 |
| Purchase Intention | 0.846 | 0.851 | 0.896 | 0.684 |
See the tables before you run the real thing
Draw your model on The Light Data’s model canvas, pick SmartPLS, and read outer loadings, reliability, AVE and HTMT tables on simulated data. It is a handy way to practice and outline your results chapter. Simulated data never replaces real data.
- Outer loading ≥ 0.708 · alpha, rho_A and CR within 0.70–0.95.
- AVE ≥ 0.50 (convergent) · HTMT below 0.85 or 0.90 (discriminant).
- Remove indicators step by step, with reasons, and record the process.
- All passed → move on to the structural model.