A little over 200 responses, skewed data, a model with mediators and moderators. AMOS will not fit, and a friend says “just use SmartPLS”. But why SmartPLS, and what will you say when your committee asks “why didn’t you use CB-SEM?” This guide explains what SmartPLS is, how it differs from AMOS, when PLS-SEM is the right choice (and when it is not), and the mistakes beginners make.
1What is SmartPLS?
SmartPLS is software for partial least squares structural equation modeling (PLS-SEM), developed by SmartPLS GmbH (Germany) under Prof. Christian M. Ringle and colleagues. It is among the most widely used PLS-SEM tools in the world and appears in many papers indexed in Scopus and Web of Science.
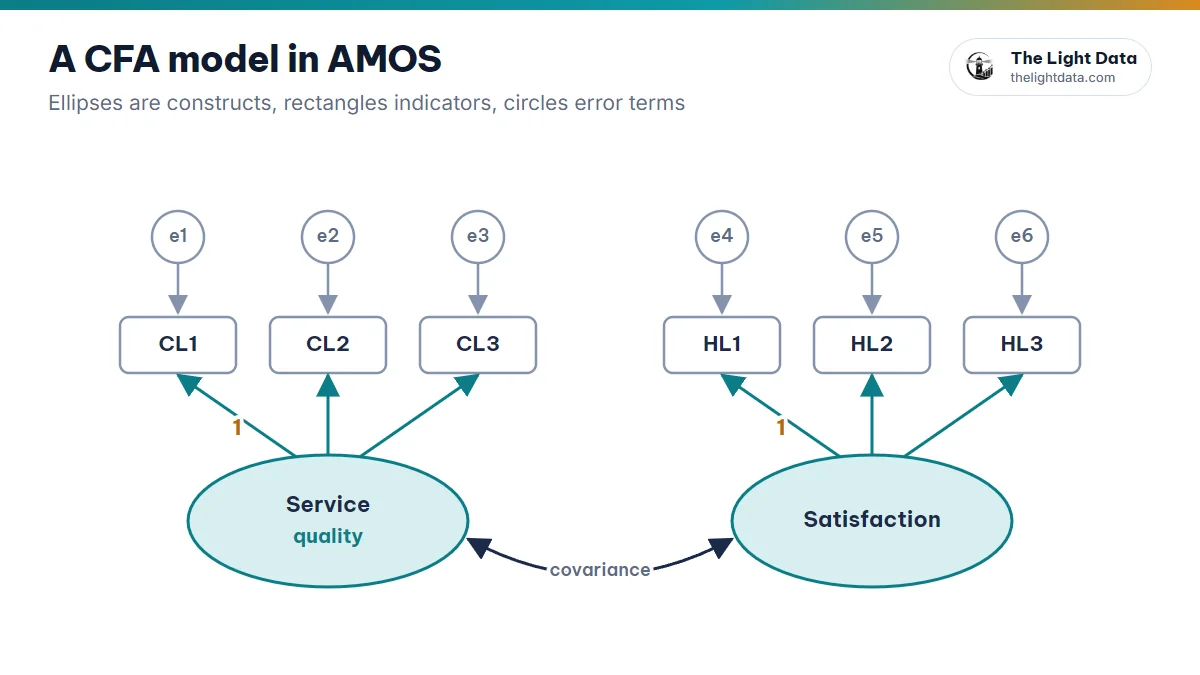
Unlike AMOS, LISREL or Mplus, which are covariance-based (CB-SEM), SmartPLS uses the PLS algorithm to maximize the explained variance of the dependent variables. In other words, it aims at explanation and prediction.
You build the model by drag and drop: create constructs, drop in your indicators, draw the hypothesis arrows, then run the PLS algorithm and bootstrapping in a few clicks.
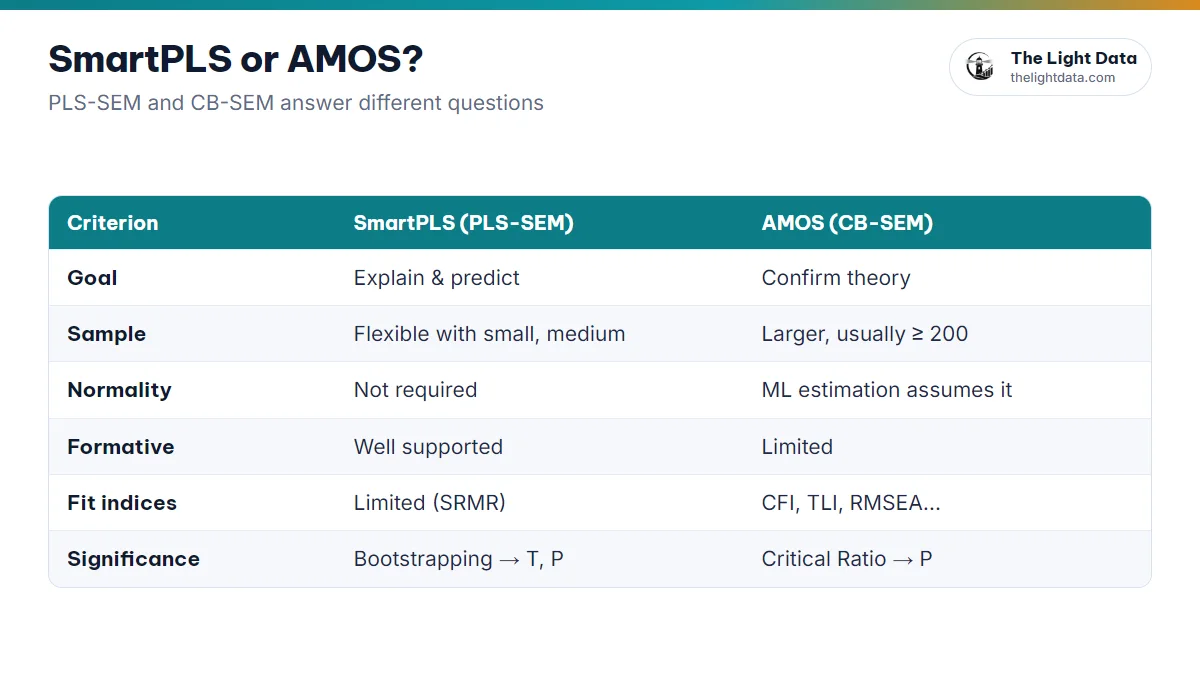
2How is SmartPLS different from AMOS?
| Criterion | SmartPLS (PLS-SEM) | AMOS (CB-SEM) |
|---|---|---|
| Goal | Explain and predict, develop theory | Test and confirm theory |
| Sample size | More flexible with small and medium samples | Needs larger samples (usually ≥ 200) |
| Normal distribution | Not required (bootstrapping) | ML estimation assumes it |
| Formative constructs | Well supported | Limited |
| Overall fit indices | Limited (SRMR) | Full set: CFI, TLI, RMSEA… |
| Significance testing | Bootstrapping → T, P values | Critical ratio → P values |
3When to choose SmartPLS, and when not to
✅ Choose it when
- The model has many constructs and paths
- The data is not normally distributed
- The sample is small or medium
- You have mediators, moderators, higher-order or formative constructs
- The aim is prediction or extending theory
⚠️ Consider CB-SEM when
- The main aim is to re-test an established theory
- Your committee or journal expects full model fit indices
- You need to compare competing models by fit
“The study aims to explain and predict the factors affecting [dependent variable]. The model has [number] constructs including a mediator, and the data is not normally distributed. According to Hair et al. (2022), PLS-SEM is an appropriate method under these conditions.”
4Where SmartPLS is used
Business and marketing
- Service quality → satisfaction → loyalty
- Online purchase intention, social media marketing
- Brand equity, customer experience, CSR
Education
- Training quality, student satisfaction
- Intention to learn online, technology adoption
- Motivation and learning outcomes
Finance and banking
- Intention to use digital banking and e-wallets
- Trust, perceived risk, investment behavior
Psychology and behavior
- TAM, TPB and UTAUT models
- Organizational commitment, work motivation, quality of life
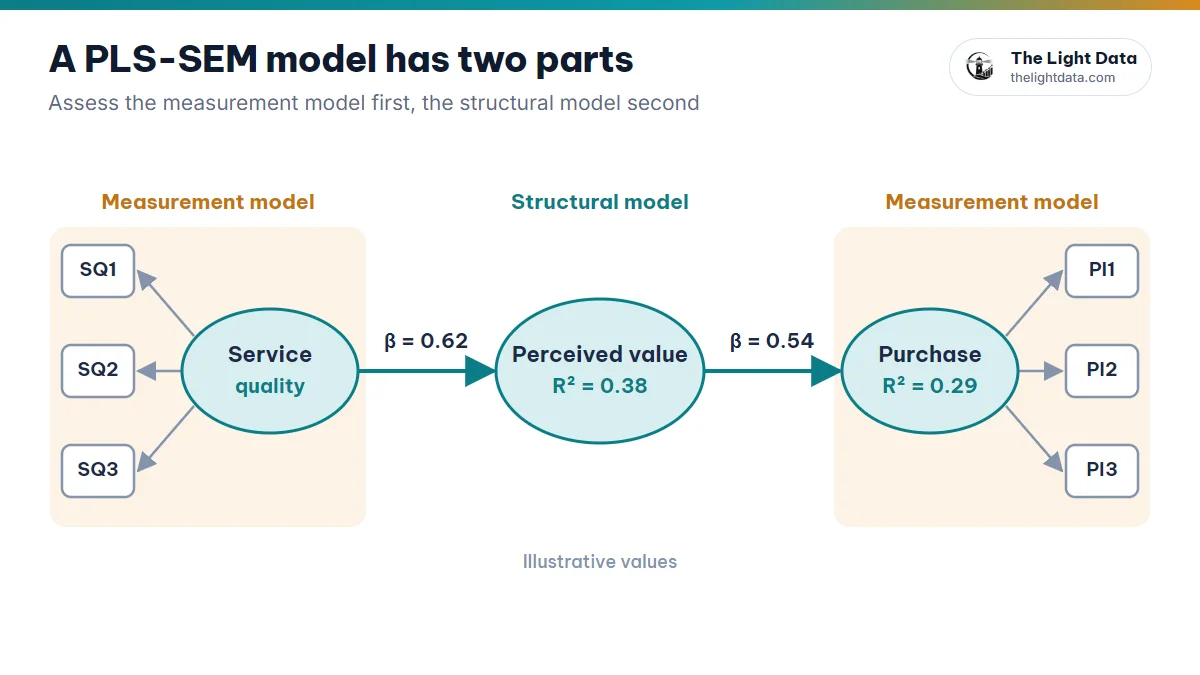
5The two-step PLS-SEM assessment process
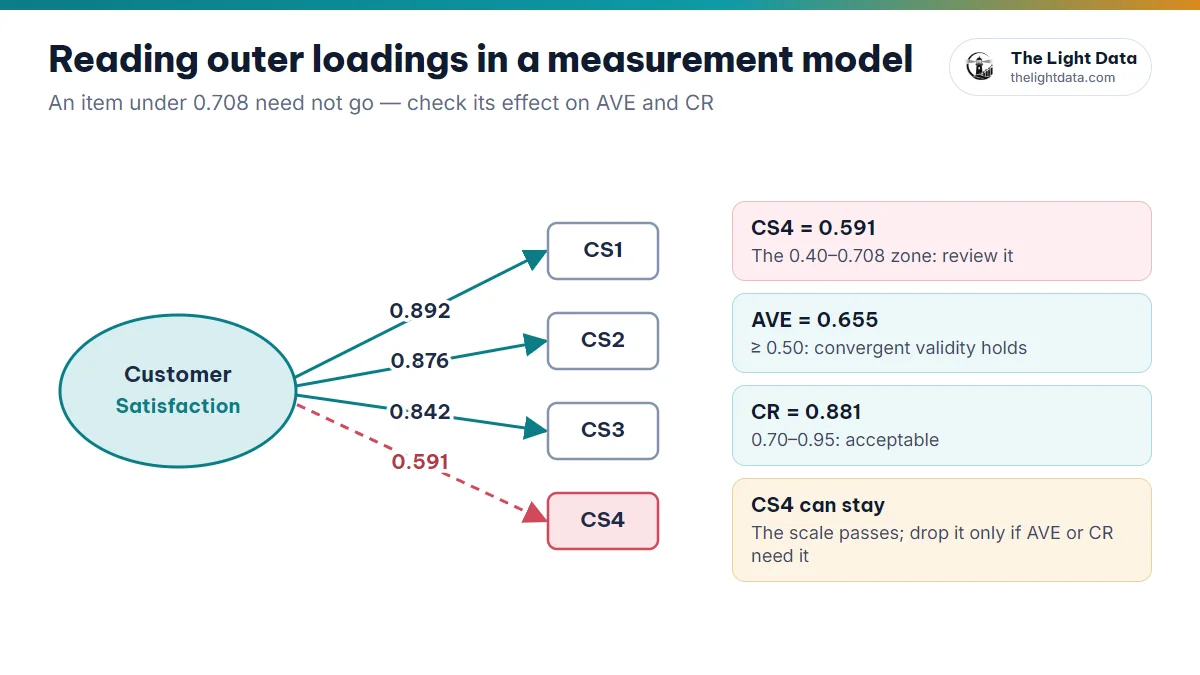
Step 1: The measurement model →
Are your scales reliable, and do they measure the right concepts?
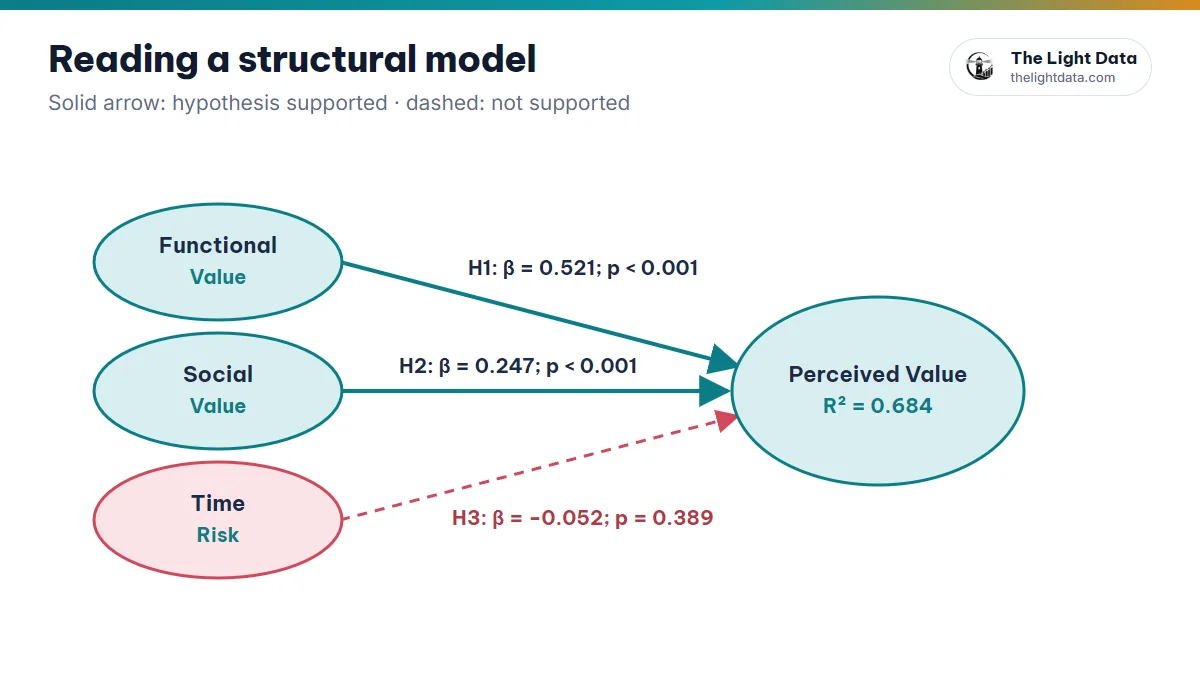
Step 2: The structural model →
Which hypotheses are supported, and how well does the model explain and predict?
66 mistakes beginners make in SmartPLS
| Mistake | What to do instead |
|---|---|
| Looking for P values in the PLS algorithm output | The algorithm only gives coefficients; P values come from bootstrapping |
| Too few bootstrap samples | Hair et al. (2022) recommend 10,000 for final results |
| Confusing reflective and formative constructs | Decide by theory: do the arrows run from the construct to the indicators (reflective) or the reverse? |
| Testing hypotheses before the scales pass | Finish step 1 (measurement) before reading structural results |
| Forgetting to reverse-code reversed items | Recode in SPSS or Excel before importing into SmartPLS |
| Blanks or an undeclared 99 in the data | Declare the missing value on import, or handle it in SPSS first |
7Start quickly with your own model
Before opening SmartPLS, draw your model on The Light Data’s model canvas: add constructs, the number of items for each, positive and negative hypothesis arrows and moderators. Pick SmartPLS to see the full set of result tables (outer loadings, HTMT, path coefficients, bootstrap) on simulated data, so you can picture what your results chapter will contain. From that same model, you can generate a Likert questionnaire with AI.
Simulated data is only for learning to read the tables and planning your analysis. It never replaces real survey data in a report.
- SmartPLS means PLS-SEM: strong at explanation and prediction, flexible with small samples, non-normal data and complex models.
- Need to confirm theory with full fit indices? Consider AMOS (CB-SEM).
- Two steps: measurement model → structural model; P values come from bootstrapping.